EurObserv’ER has been gathering data on European Union renewable energy sources for twenty years to describe the state and development of the sectors in themed barometers. The first part of this opus is a summary of the barometers released in 2019 for the wind energy, solar photovoltaic, solar thermal, CSP, biofuel, ocean energies and solid biomass sectors. The summaries have provided the opportunity to consolidate all the energy indicators with the official (consolidated) 2017 and 2018 data.
Category Archives: 2019
État des énergies renouvelables en Europe 2019
Comme chaque année, depuis plus de vingt ans, Observ’ER a réalisé avec ses partenaires le “Baromètre européen des énergies renouvelables”1. Un arrêt sur image qui montre que la part de l’énergie provenant de sources renouvelables atteint en moyenne 18 %, en progression constante (0,5 % par an), et proche de l’objectif communautaire (20 % en2020). Clin d’oeil de l’histoire, la sortie du Royaume-Uni de l’Union européenne, effective depuis le 1er février dernier, permet même d’atteindre le score de 18,9 %.
Solid biomass barometer 2019
 -0.3% The growth of inland consumption from solid biomass in the EU between 2017 and 2018
Solid biomass energy consumption trend swings depend on public policies promoting its use, but they are also highly susceptible to weather conditions. In 2018, it was a mixed bag, with variations across its uses. The demand for heat declined in the European Union, due to a milder winter, while there was a rise in electricity production. All in all, the sector’s primary energy consumption was stable (0.3% lower than in 2017) and is still below the 100 Mtoe threshold (99.3 Mtoe).
Download
Download in other languages : ![]()
Baromètre Biomasse Solide 2019
 -0.3% L’augmentation de la consommation d’énergie primaire de biomasse solide dans l’UE entre 2017 et 2018
L’évolution de la consommation d’énergie biomasse solide est tributaire des politiques publiques favorisant son utilisation, mais elle est également fortement soumise aux aléas climatiques. En 2018, l’évolution de la consommation de biomasse solide a été contrastée. Au sein de l’Union européenne, une baisse de la demande de chaleur, due à un hiver moins froid qu’en 2017, a été observée ainsi qu’une hausse de la production d’électricité.
Au final, la consommation d’énergie primaire de la filière est globalement stable (-0,3 % par rapport à 2017) et reste sous le seuil des 100 Mtep (99,3 Mtep).
Ocean Energy barometer 2019
 243,4 MW Capacity of ocean energy officially registered in the EU at the end of 2018
The ocean energy sector has been a beehive of activity over the last three years with many prototypes being submerged off the British, Brittany, North Sea and Mediterranean coastlines. Tidal stream energy leads wave energy conversion and the other technologies in this ocean race. This is the first time that the sector has been specifically monitored for a regular EurObserv’ER theme-based barometer.
Download in English
Download in other languages : ![]()
Baromètre énergies marines 2019
 243,4 MW La puissance énergies marines officiellement recensée dans l’UE fin 2018
La filière des énergies marines est en pleine effervescence avec un nombre significatif de prototypes immergés ces trois dernières années, que ce soit au large des côtes britanniques ou de la Bretagne, en mer du Nord ou en mer Méditerranée. Dans cette course à l’océan, l’énergie des courants a un temps d’avance sur l’énergie des vagues et les autres technologies. Cette filière fait pour la première fois l’objet d’un suivi thématique dans le cadre des baromètres EurObser’ER.
Biofuels barometer 2019
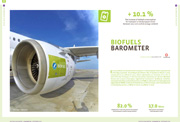 + 10.1 % The increase of biofuels consumption for transport in the European Union between 2017 and 2018 (in energy content)
In 2018, biofuel consumption for transport in the European Union experienced a two figure growth. According to EurObserv’ER, it reached 17 Mtoe in 2018, compared to 15.4 Mtoe in 2017, which represents an increase of 10.1%, in line with the increase in the incorporation mandates of certain Member States and a secure European legislative framework. Biodiesel, whether conventional (fatty acid methyl esters or FAME) or derived from hydrogenated vegetable oil (HVO), is the main beneficiary of this increase, with consumption increasing by nearly 1.5 Mtoe to reach 13.9 Mtoe in 2018.
Download in English
Download in other languages : ![]()
Baromètre biocarburants 2019
 + 10,1 % La hausse de la consommation de biocarburants dans les transports de l’Union européenne, entre 2017 et 2018 (en contenu énergétique)
La consommation de biocarburants dans les transports de l’Union européenne a connu en 2018 une croissance à deux chiffres. Selon EurObserv’ER, elle a atteint les 17 Mtep en 2018, contre 15,4 Mtep en 2017, soit une augmentation de 10,1 %, en lien avec la progression des mandats d’incorporation de certains États membres et un cadre législatif européen sécurisé. Le biodiesel, qu’il soit classique (type Emag – ester méthylique d’acide gras) ou issu d’huiles végétales hydrogénées (type HVO), est le principal bénéficiaire de cette augmentation. Sa consommation gagne près de 1,5 Mtep pour atteindre 13,9 Mtep en 2018.
Solar thermal and concentrated solar power barometer 2019
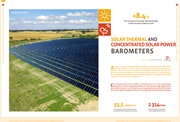 +8.4 % The increase of the solar thermal market in the European Union in 2018
At long last, after a sluggish decade of decline, the European Union solar thermal market for hot water production and heating applications appears to have returned to growth. According to EurObserv’ER, the 2018 European market posted a rise of some 8.4% compared to 2017, which equates to 2.2 million m2 of newly-installed surface. However, the amounts of growth vary by country and market segment.
Download in English
Download in other languages : ![]()
Baromètres solaire thermique et solaire thermodynamique 2019
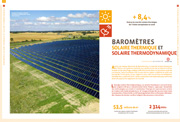 +8.4 % Hausse du marché solaire thermique de l’Union européenne en 2018
Après une longue décennie de décroissance, le marché solaire thermique de l’Union européenne destiné aux applications de production d’eau chaude et de chauffage semble enfin être entré dans un nouveau cycle de croissance. Selon EurObserv’ER, le marché européen a affiché en 2018 une hausse de l’ordre de 8,4 % par rapport à 2017, soit une surface nouvellement installée de 2,2 millions de m2. Cette croissance n’est cependant pas uniforme selon les pays et les segments de marché.
Photovoltaic barometer 2019
 114 549 MW Cumulative photovoltaic capacity
in the European Union at the end of 2018
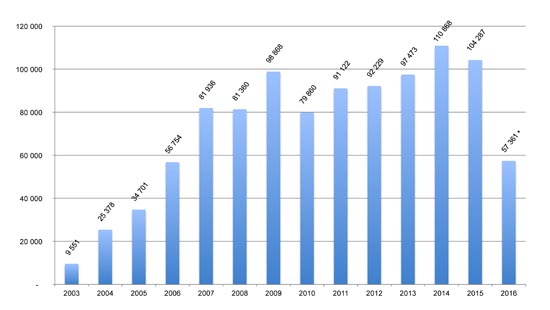
The global photovoltaic base continues to make inroads across the five continents. At the end of 2018, its capacity exceeded half a million megawatts, which equates to about 100 GW of newly-installed capacity. In 2018, China’s market faltered, while there was a revival in the European Union market and the emerging markets picked up steam.
Baromètre Photovoltaïque 2019
 114 549 mW La puissance photovoltaïque cumulée de l’Union européenne fin 2018
Le parc mondial photovoltaïque continue de s’étendre sur les cinq continents. Fin 2018, il a dépassé le demi-million de mégawatts, soit une capacité supplémentaire installée de l’ordre de 100 GW. L’année se caractérise par le recul du marché chinois, la renaissance de l’Union européenne et une montée en puissance des marchés émergeants.
Télécharger en Français
Download in other languages : ![]()
Wind energy barometer 2019
 379.3 TWh The estimated electricity production from wind power in the EU in 2018
Data released by the GWEC shows that newly-installed capacity across the globe slipped slightly (by 3.6%) in 2018 with 51.3 GW compared to 53.2 GW in 2017. This additional capacity takes total wind turbine capacity to 591 GW at the end of 2018, including 23 GW of offshore capacity. The most recent drop in the global installation figure – the third in succession – can be put down to significant contraction in the European and Indian markets that was not entirely offset by the return to growth of the Chinese and United States markets.
Baromètre éolien 2019
 379,3 TWh : production d’électricité éolienne estimée dans l’Union européenne en 2018
Selon les données du GWEC, la puissance installée dans le monde au cours de l’année 2018 était en légère diminution (- 3,6 %) par rapport à 2017, avec 51,3 GW en 2018, comparés aux 53,2 GW en 2017. Cette puissance supplémentaire porterait la puissance éolienne à 591 GW fin 2018, dont 23 GW situés en mer. Cette nouvelle baisse du niveau d’installation mondial, la troisième consécutive, s’explique cette année par une contraction importante des marchés européens et indiens qui n’a pas été entièrement contrebalancée par le retour à la croissance des marchés chinois et états-uniens.


