Category Archives: 2016

État des énergies renouvelables en Europe

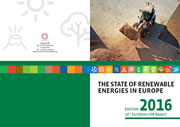
EtatdesENR-2017-FRDepuis dix-sept ans, EurObserv’ER collecte des données sur les sources d’énergies renouvelables de l’Union européenne afin de décrire, dans des baromètres thématiques, l’état et la dynamique des filières. La première partie de cet ouvrage constitue une synthèse des baromètres diffusés en 2016 pour les filières éolienne, photovoltaïque, solaire thermique, pompes à chaleur, biocarburants et biomasse solide. Les données issues des ces baromètres ont été consolidées et complétées avec les données portant sur les filières non couvertes par des baromètres thématiques : la petite hydraulique, le biogaz, l’énergie géothermique, le solaire thermodynamique, l’incinération des ordures ménagères et les énergies marines renouvelables.

Ce dossier offre donc un tour d’horizon complet de la dimension énergétique des douze filières renouvelables développées, aujourd’hui, à une échelle industrielle au sein de l’Union européenne.


Télécharger

Wind energy barometer 2016

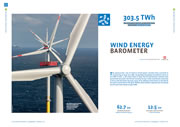
303.5 TWh The estimated electric production from wind power in the EU in 2015
The spectacular rise of China’s wind power market that resulted in connecting at least 30.5 GW, catapulted the global installation level to 62.7 GW in 2015– a 22% more than in 2014! The US and German markets also performed very well, the former because its tax credit mechanism remained in force and the latter because many of its offshore wind farms in the North Sea were connected to the grid. Global wind turbine capacity has increased by 17% and now stands at 432.6 GW.

Download in English
Download in other languages : french

Photovoltaic barometer 2016

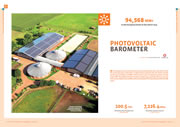
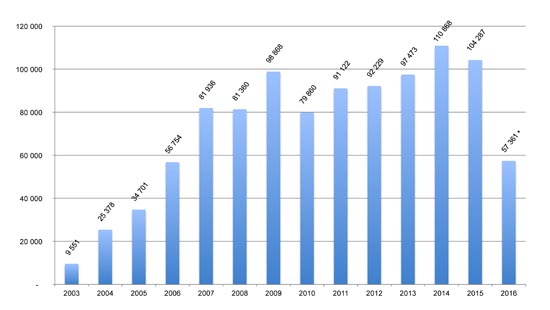
94,568 MWp in the European Union at the end of 2015
The European Union solar photovoltaic market picked up in 2015 after three successive years of decline. It registered 3% growth over the twelve-month period, by installing 7 226 MW, which took Europe’s installed capacity to date to 94.6 GW. The global market soared by comparison, gaining 25% year-on-year and connecting at least 50 GW, which took global PV capacity past the 227-GW mark.

Download in English
Download in other languages : french

Solar thermal and concentrated solar power barometer 2016

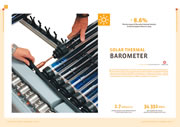
– 8.6% The decrease of the solar thermal market in the European Union in 2015
In 2015, the European Union saw its solar thermal market contract for the seventh year in a row. EurObserv’ER puts sales of solar thermal capacity installed for the heating market (hot water and space heating) at 1 861 MWth, equivalent to a 2.7 million m² of collectors… a further 8.6% decrease on the previous year’s poor performance. Combined solar thermal capacity installed to date in the EU stands at 34.3 GWth, or 49 million m² of collectors.

Download in English
Download in other languages : french

Biofuels barometer 2016

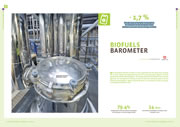
– 1.7% The decrease of biofuels consumption for transport in the European Union between 2014 and 2015 (in energy content)

The European biofuel market is now regulated by the directive, known as ILUC, whose wording focuses on the environmental impact of firstgeneration biofuel development. This long-awaited clarification has arrived against the backdrop of falling oil prices and shrinking European Union biofuel consumption, which should drop by 1.7% between 2014 and 2015, according to EurObserv’ER.

Download in English
Download in other languages : french

Heat pumps barometer 2016

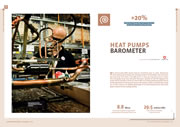
+20% : the increase of the heat pump market in the EU between 2014 and 2015
The heat pump (HP) sector had an excellent year in 2015. Appliance sales taking all heating and cooling market technologies into account, increased by 20% from 2 212 898 units in 2014 to 2 655 331 units in 2015. The emerging trend over the past few years specific to the HP segment for water-borne systems is that air-source HPs are clearly gaining market shares to the detriment of the ground-source HP market, while reversible HPs using air as their vector are taking advantage of record temperatures that have given a boost to the cooling market.

Download in English
Download in other languages : french germany

Solid biomass barometer 2016

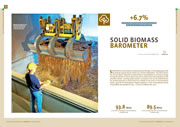
+ 6.7% the growth of electricity from solid biomass in the UE between 2014 and 2015

Solid biomass consumption, primarily wood energy, is still largely governed by heating requirements which are climate-dependent. The main factor for the European rebound in solid biomass consumption as primary energy during the winter of 2015 is that it was not as mild across the continent as the previous winter. Leaving aside climatic variations, the use of solid biomass for producing heat or electricity has tended to increase in the European Union, spurred on by European support policies. A new consumption record of 93.8 Mtoe was posted in 2015… a rise of 3.8 Mtoe over 2014.

Download in English
Download in other languages : french germany

16th annual overview barometer

EurObserv’ER has been gathering data on the European Union’s renewable energy sources for seventeen years for its themebased barometer reports on the state of the sectors and their momentum. The first part of this work is a summary of the barometers published in 2016 for the wind energy, solar photovoltaic, solar thermal, heat pump, biofuel and solid biomass sectors. The data drawn from these barometers has been updated and supplemented by data on the sectors for which no individual barometers were published – small hydropower, biogas, geothermal energy, concentrated solar power, household refuse incineration and renewable marine energy sources.

Hence this publication offers a comprehensive energy dimension review of the twelve renewable sectors that are now developed in the European Union on an industrial scale. It also gives for the first time a view of the share of RES heating and cooling in the building stock.

Download in English
Download in other languages : french

Methodology papers related to the 16th annual barometer


Main findings of the 16th overview barometer

Summary brochure