Category Archives: 2017

17th annual overview barometer

EurObserv’ER has been gathering data on the European Union’s renewable energy sources for eighteen years for its themebased barometer reports on the state of the sectors and their momentum. The first part of this work is a summary of the barometers published in 2017 for the wind energy, solar photovoltaic, solar thermal, biofuel, biogas and solid biomass sectors.

The energy indicators drawn from these barometers have been updated with SHARES data from 26th January and supplemented by data on the sectors for which no individual barometers were published – small hydropower, heat pumps, geothermal energy, concentrated solar power, household refuse incineration and renewable marine energy sources. Continue reading 17th annual overview barometer


Solar thermal and concentrated solar power barometer 2017

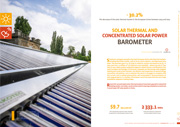
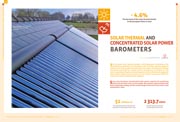
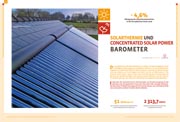
2017-BaroST-Helio-GB-1– 4.6% The decrease of the solar thermal market in the European Union in 2016
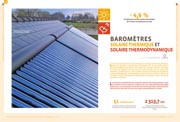
The European solar thermal market is still losing pace. According to the preliminary estimates from EurObserv’ER, the solar thermal segment dedicated to heat production (domestic hot water, heating and heating networks) contracted by a further 4.6% in 2016 down to 2.6 million m2. The sector is pinning its hopes on the development of the collective solar segment that includes industrial solar heat and solar district heating to offset the under-performing individual home segment.

Download in English
Download in other languages : french   germany

Baromètres solaire thermique et solaire thermodynamique 2017

2017-BaroST-Helio-FR-1– 4,6 % la baisse du marché solaire thermique de l’Union européenne en 2016
Le marché européen du solaire thermique continue sa lente décélération. Selon les premières estimations d’EurObserv’ER, le marché du solaire thermique dédié à la production de chaleur (eau chaude sanitaire, chauffage et réseau de chaleur) s’est de nouveau contracté de 4,6 % en 2016, pour atteindre 2,6 millions de m2. Pour pallier la baisse d’intensité du marché des maisons individuelles, le développement du marché du solaire collectif, de la chaleur solaire industrielle et des réseaux de chaleur solaire reste très attendu par la filière.

Télécharger

Solar thermie und Concentrated solar power Barometer 2017

Baro_ST_Helio_2017_de_final-1–  4,6% Rückgang des Solarthermiemarktes in der Europäischen Union 2016
Der europäische Solarthermiemarkt ist weiter auf dem Rückgang. Nach vorläufigen Schätzungen des EurObserv’ER hat sich das Solarthermie- Segment zur Wärmeproduktion (Warmwasser, Heizung und Wärmenetze) 2016 um weitere 4,6 % verringert und steht nun bei 2,6 Millionen m2. Die Branche hofft daher, dass es über die Entwicklung des Solarmarktes im Bereich der Kollektivanlagen, der solaren Industriewärme und der solaren Fernwärme gelingt, das schwache Einfamilienhaussegment auszugleichen.

Herunterladen

Biokraftstoff barometer 2017

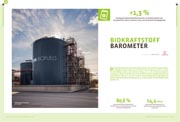
2017-Baro Biofuel-DE_final-1+1,3 % Anstieg des Biokraftstoffverbrauchs im Verkehrssektor der Europäischen Union zwischen 2015 und 2016 (nach Energiegehalt)
Der Biokraftstoffverbrauch im Verkehrssektor hat 2016 leicht zugenommen. Vorläufigen Schätzungen des EurObserv’ER zufolge lag er bei 14,4 Mio. Tonnen Öläquivalent, was einem Anstieg von 1,3 % im Jahresvergleich entspricht. Dieser Anstieg lässt sich sämtlich auf den Biodieselverbrauch zurückführen, der um 2,4 % auf 11,6 Mio. Tonnen Öläquivalent gestiegen ist, während der Bioethanol-Verbrauch um 3,1 % auf 2,6 Mio. Tonnen Öläquivalent gefallen ist.

Herunterladen

Biofuels barometer 2017

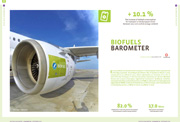
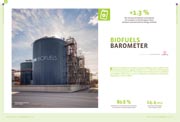
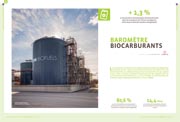
2017-Baro-Biocarburants-GB-1+1.3 % The increase of biofuels consumption for transport in the European Union between 2015 and 2016 (in energy content)
Biofuel consumption for transport increased slightly in 2016. EurObserv’ER’s preliminary estimates suggest the figure of 14.4 million toe, which equates to 1.3% year-on-year growth. This increase was entirely driven by biodiesel consumption (which rose 2.4% to 11.6 Mtoe), as bioethanol consumption slipped (by 3.1% to 2.6 Mtoe).

Download in English
Download in other languages : french  germany

Baromètre biocarburants 2017

2017-Baro-Biocarburants-FR-1+ 1,3 % la hausse de la consommation de biocarburants dans les transports de l’Union européenne, entre 2015 et 2016 (en contenu énergétique)
La consommation de biocarburants à destination des transports a légèrement augmenté en 2016. Selon les premières estimations d’EurObserv’ER, elle devrait atteindre 14,4 millions de tep, soit une croissance de 1,3 % par rapport à 2015. Cette croissance s’explique uniquement par une augmentation de la consommation de biodiesel (+2,4 % à 11,6 Mtep), la consommation de bioéthanol ayant légèrement diminué (-3,1 % à 2,6 Mtep).

Télécharger

Photovoltaik Barometer 2017

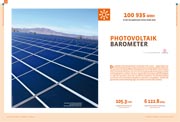
2017_Baro_PV_tableaux_DE_final-1100 935 MWp in der Europäischen Union Ende 2016
Der globale Solarenergiemarkt entwickelt sich rasant – angetrieben von der enormen Nachfrage auf den asiatischen und amerikanischen Märkten. 2016 knackte der globale Photovoltaik-Markt die 76-GW-Marke und erreichte einen maximalen Zuwachs von 50 %. Der europäische Markt hingegen scheint sich festgefahren zu haben. Die dort zugebaute Leistung betrug 2016 lediglich 6,1 GW und lag damit unter den 7,9 GW des Vorjahres. Um den Marktanteil von Strom aus erneuerbaren Quellen in Zukunft zu vergrößern, werden die gesetzlichen Rahmenbedingungen des Sektors derzeit überarbeitet.

Herunterladen

Wind energy barometer 2017

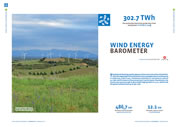
302.7 TWh The estimated electricity production from wind power in the EU in 2016
The global wind energy market appears to have encountered its initial limits. Since the beginning of the millennium it has expanded almost continuously to achieve 64.4 GW in 2015. Preliminary estimates for 2016 point to sales of 54.2 GW, which is down on the previous year’s performance. Nonetheless, the results were good enough to give double digit growth of 12.4%, which took the global installed base up to 486.7 GW.

Download in English
Download in other languages : french

Photovoltaic barometer 2017

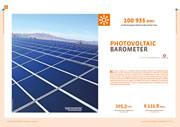
100 935 MWp in the European Union at the end of 2016
Not just a wave, it’s a breaker that has made landfall on the global solar power market, driven by strong Asian and American demand. The global solar photovoltaic market surged past the 76 GW mark in 2016, with peak growth at 50%. The European market seems to have drifted into slack water. It connected only 6.1 GW of additional capacity in 2016 and in doing so slipped below the previous year’s figure of 7.9 GW. The sector’s regulatory framework is being overhauled with a view to integrating more renewably-sourced electricity into the market.

Download in English
Download in other languages : french     germany